The last three months have seen a surge in uncertainty across the US and Canada, with a myriad of factors causing turbulence for businesses. Employment data now drives central bank policy more than ever, so we wanted to dive deeper into the data and what it means.
Canada: Key Employment Data
- Employment rate: 60.7% (down 0.2%, lowest in 8 months)
- Unemployment rate: 6.9% (unchanged from June and at a multi-year high)
- Participation Rate: 65.2% (-0.2% vs June)
Jobs:
- Total new jobs: -40,800 jobs in July (vs +83,000 in June; well below estimates of +13,000)
- Full-time jobs: -51,000 (vs +53,000 in June)
- Part-time jobs: +10,000 (vs +30,000 in June)
The bulk of the job losses in July were among workers aged between 15 and 24, with unemployment hitting 14.6%, the highest since September 2010 (excluding 2020 & 2021).
Oxford Economics' Davenport predicts additional layoffs ahead, forecasting about 140,000 lost jobs and unemployment climbing to the mid-7% range later this year. Statistics Canada's Survey of Employment, Payrolls and Hours (SEPH) confirmed this weakness, showing 32,500 jobs lost in June.
Change in employment by industry - July, 2025 (thousands)
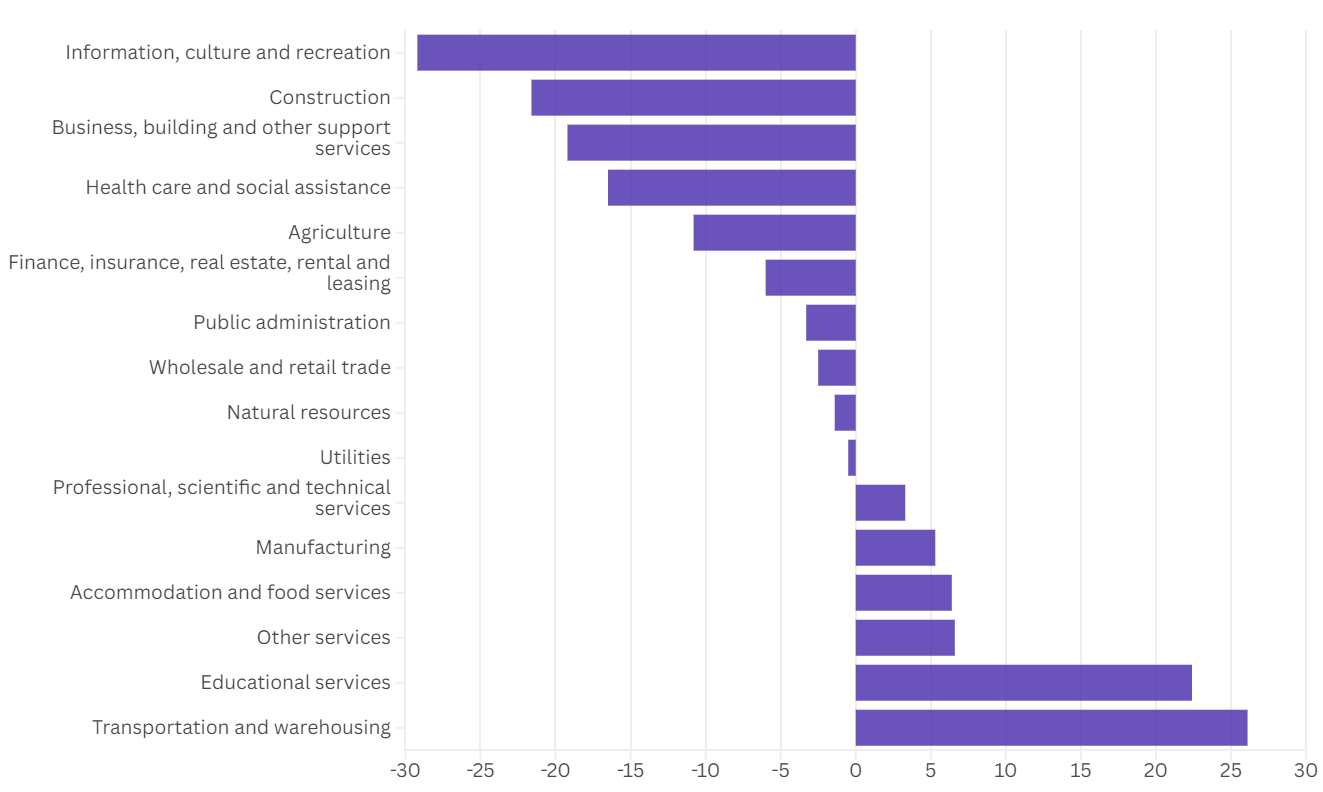
Looking ahead, Canada's employment situation will likely continue to deteriorate in the short term given the multitude of pressures that exist. Lower rates in addition to industry-specific government support will provide some relief. However, it will take some time for tariff-affected businesses, as well as the broader economy, to adjust.
Adding to these pressures, federal cuts of 15% across several departments to fund increased military spending will put further pressure on the job market. We believe continuing this agenda of job cuts through 2028 is unsustainable for the federal government.
Interest Rates
Market odds for a September rate cut have increased to 48% from 40% before the latest Q2 GDP and spending data. Two more rate cuts are priced in for 2025, with three meetings remaining (Sept, Oct, Dec).
We don't think a September cut is necessary right now. While markets are pricing roughly even odds, the economic weakness in jobs and exports was largely anticipated. The Bank of Canada has already considerably cut rates, and these effects will take some time to be seen.
The BoC's room to maneuver is limited. With inflation excluding gasoline at 2.5% and the policy rate at 2.75%, there’s little room to cut.
Tariffs and Trade
U.S. tariffs on steel, aluminum, and autos have contributed to roughly 26,000 job losses in Canada's manufacturing sector this year. In a recent policy shift, the Canadian government dropped all previous counter tariffs on US goods which are CUSMA-compliant, keeping only steel, aluminum, and automobile tariffs. We don't anticipate major tariff changes in the near future.
Inflation
July's CPI data shows headline inflation at 1.7%, down from 1.9% in June. CPI excluding gasoline was flat at 2.5%. Energy continues to be the main deflationary force in total CPI (-10.4%), while food and shelter were up 0.4% and 0.2% MoM, hitting 3.3% and 3% respectively.
Housing costs present a persistent challenge. Food and shelter inflation has been extremely sticky and shows no signs of slowing in the short-to-medium term. Lower rates will do little to reduce mortgage interest costs (5.6% of CPI) since most Canadian mortgages are fixed-rate. Importantly, 60% of borrowers will soon refinance from sub-2% pandemic-era rates to current rates near 4%.
Rent inflation (7.2% of CPI) will be a tougher category to tackle with no clear signs of improvement in rental housing supply.
Energy price deflation is the primary reason headline CPI sits below 2% in Canada right now. Lower base prices from last year combined with the removal of federal fuel charges in April have considerably brought down energy prices. Any sizable increases in global energy prices next year could drive headline inflation above 3%, and will put the BoC in a difficult position. The most difficult issue to gauge will be to what extent price increases are transitory, and whether tariff-affected sectors can adjust and recover.
We think the next one or two CPI prints will be flat or slightly up, with stable energy prices and most US-Canada trade covered by CUSMA (85-95%). After that, we see building pressure from key CPI categories.
Economic Activity
Canada’s Services PMI increased 11.3% MoM to 49.3, just below contraction territory. Household consumption (+1.1%) and government expenditure (+1.8%) were both up in Q2, showing resilience.
Small business confidence signals ongoing stress. Despite recent improvements, 12-month Small Business confidence decreased in August to 47.8, after a steady increase the past few months, highlighting persistent challenges for Canadian SMBs. Meanwhile, Q2 exports declined 7.5% (vs +1.4% in Q1), led by tariff-impacted sectors (Vehicles, Industrial Machinery), and dragged real Q2 GDP down 0.4% vs an uptick of 0.5% in Q1.
United States
The dominant story in US employment has been the massive revision for May and June (-258k combined) in addition to Fed Chair Powell's most recent speech at Jackson Hole.
Key Employment Data
- Employment Rate: 59.6% (down from 59.7% in June)
- Unemployment rate: 4.2% (up from 4.1% in June)
- Participation Rate: 62.2% (down from 62.3% in June and from 62.6% in January)
Jobs
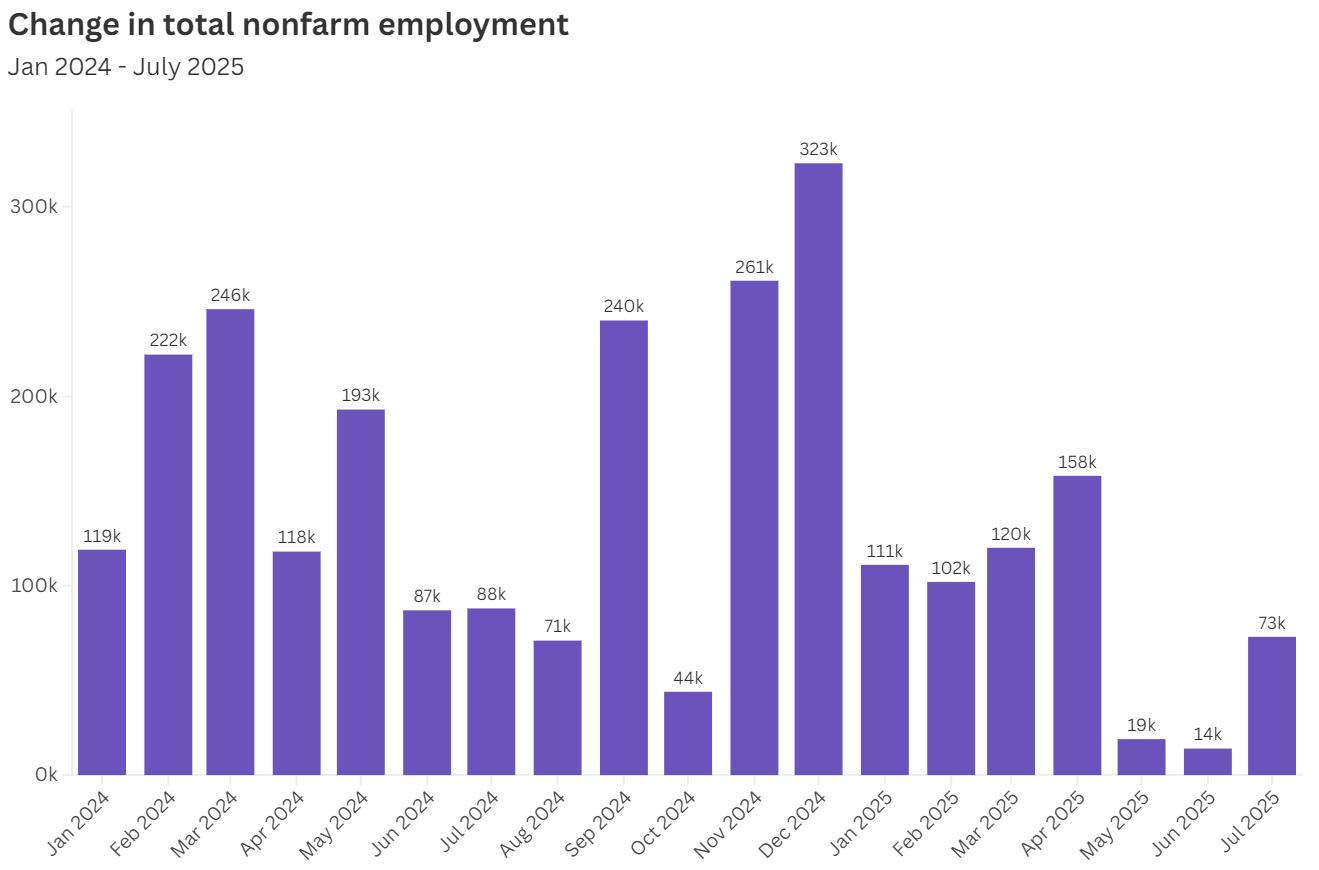
- July Non-Farm Payrolls: +73,000 jobs (below economist expectations of 100,000+, largest slowdown since 2020)
- June Non-Farm Payrolls revised down from 147,000 to 14,000 (first revision)
- May Non-Farm Payrolls: revised down from 144,000 to 19,000 (second revision)
Notably, the only other times we had two months of 100,000+ downward revisions in the last 20 years were during the pandemic and the global financial crisis.
Healthcare & social assistance led the job growth in July (+73,000 jobs**), with manufacturing losing 11,000 jobs and government job losses reaching 10,000. The number of Americans unemployed for 27 weeks or more rose to 1.8 million, marking an 11% increase.
It's important to note that when it comes to the major revisions for May and June, the effects of the survey methodology matter. The pool of companies that respond has shrunk over time, and only 60% of companies respond in the first month (compared to ~90% after two months).
The latest numbers clearly indicate that the US job market has experienced weaker job growth in recent months, with longer-term doubts creeping into its resilience. Manufacturing jobs have been hit by tariffs along with a systemic shedding of government jobs.
Inflation
July Headline CPI came in at 2.7% (+0.2 vs June), with Core CPI up to 3.1% (+0.3% vs June). Headline PCE went up to 2.6% (+0.2% vs June), and Core PCE was up to 2.9% (+0.1% vs June). Core measures have been above headline numbers due to the deflationary pressure coming from energy. The 2024 average crude price per barrel was ~$80 compared to ~$71 for this year, which has pulled headline inflation down in 2025.
A concerning category this year has been electricity, with inflation in July at 5.5% and hovering above 5% all year.
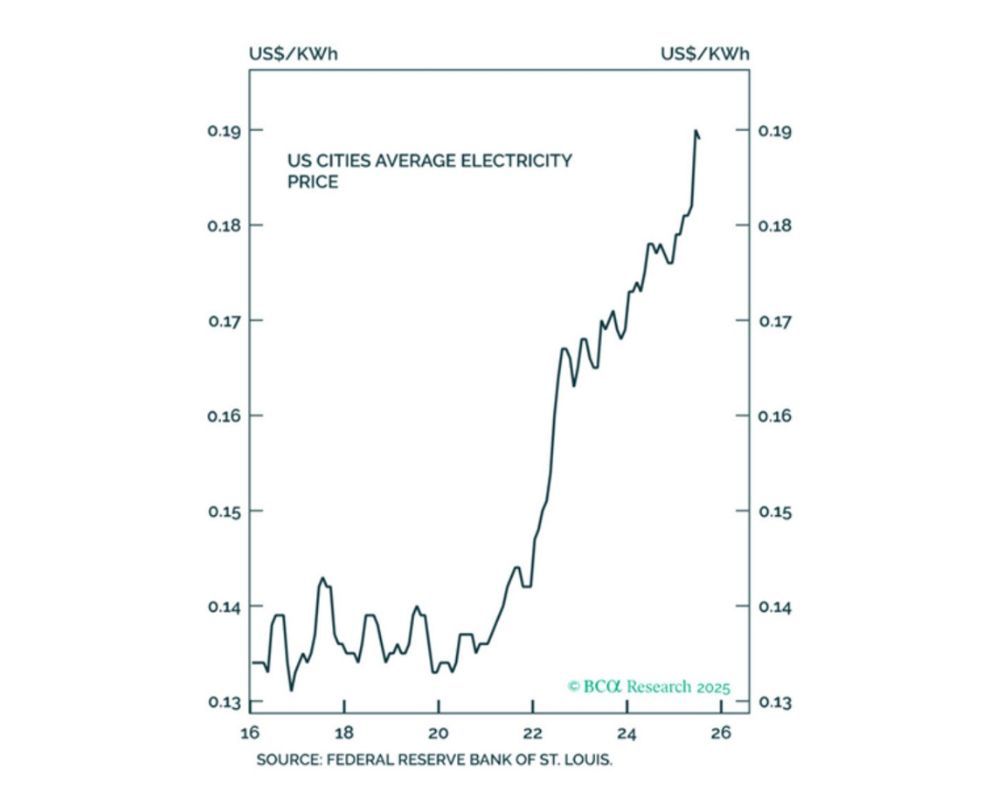
As Powell noted, there will likely be a period of slow increases in inflation over the next year with varying impacts by segment. We think the electricity segment will come under increased pressure due to massive electricity demand coming from data centers, as well as an already strained grid.
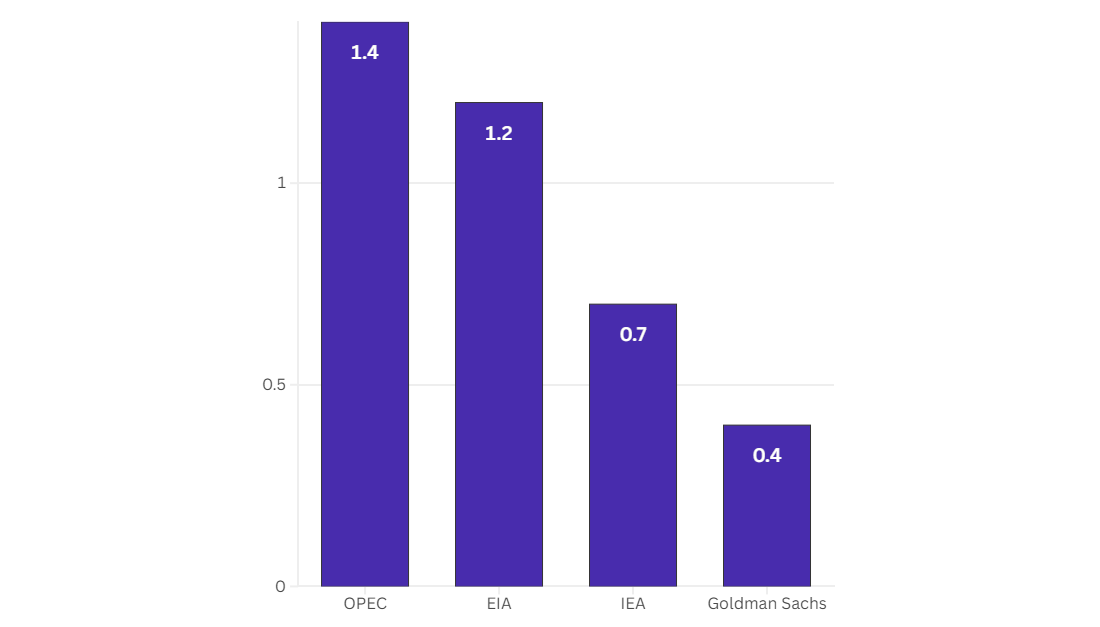
On the energy front, oil demand and price predictions for 2026 next year vary drastically, as has been the theme in recent years between OPEC+ and the IEA. Critically, we believe the risk of price spikes next year is currently underestimated. Stronger than anticipated oil demand paired with lower supply could push oil prices above this year's range. Any geopolitical escalation added to this scenario could cause a major spike.
2026 Expected Oil Demand Growth (mpbd)
Economic Activity
Q2 Real GDP increased 3.3% after being down in Q1 due to the outsized imports prior to the tariff deadline. Consumer activity remained solid with personal income (+0.4%), personal spending (+0.5%), and disposable personal income (+0.4%) all increasing in July on a monthly basis. No major red flags in the data; consumer and government numbers show resilience for now.
Looking Ahead: Pressure Points and Planning Priorities
During this period of uncertainty, businesses should emphasize scenario analyses and examine where new cost pressures might emerge for their operations. Key categories to monitor include:
Electricity & Power
Inflation has remained at 5%+ all year with wholesale price surges, made worse by extreme weather and soaring data center demand. Data centers are projected to account for 30–40% of net new electricity demand through 2030, putting further stress on the aging grid infrastructure.
Energy
Oil prices are expected to stay flat or decline, though the risk of supply-driven spikes remains due to geopolitical or weather events. We also believe demand growth in emerging markets might be underrepresented and could contribute to an upside spike. Natural gas prices are expected to increase by roughly 20% in the U.S. next year due to slowing production and growing exports.
Manufacturing Inputs
Tariff effects are mostly sector-specific right now, with steel, aluminum, and related goods facing elevated price pressures. Beyond direct impacts, other ancillary inputs throughout manufacturing supply chains may also encounter rising costs over time.
Downstream Services
Secondary tariff effects will permeate service industries over time, as software companies and service companies more broadly face elevated costs. Businesses should expect gradual price pass-through across a range of services as indirect cost pressures accumulate.
Both countries face persistent labor market pressures and supply-side disruptions that monetary policy alone cannot address. Businesses should prepare for extended economic uncertainty with particular focus on their cost inputs and supply chain resilience